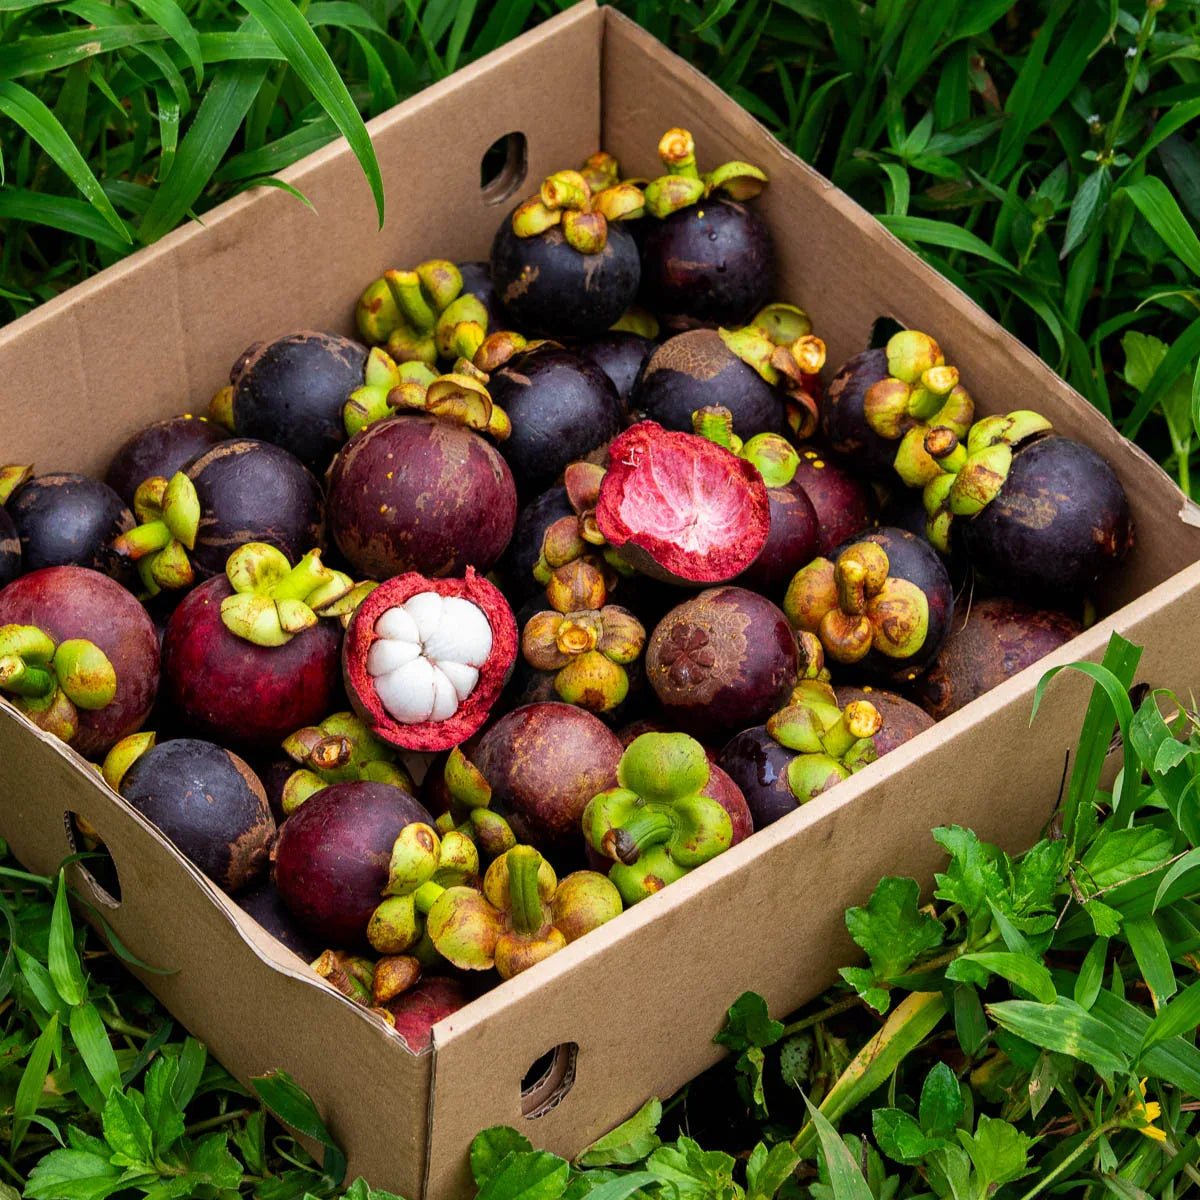
+484 %
Year-over-year revenue, Jurassic Fruit (2020–2021)
E-Commerce Growth · The Money Path
Before we buy more traffic, we optimize the path from existing interest to actual contribution margin.
Peak Atlas optimizes online shops along their entire money path, from payment, checkout and cart through product pages and repeat purchases to Google Ads, Shopping and new demand.
We don't automatically start with more traffic. We start where additional economic value is most likely to be created.
For established e-commerce companies with existing demand.

The Path of Money
From money already earned back to new demand.
+484 %
Year-over-year revenue, Jurassic Fruit (2020–2021)
10–12
ROAS of the Google Ads campaigns, Lill's





Historical project references from published case studies.
The problem
A shop can grow and still leave money on the table.
Maybe you buy traffic too expensively. Maybe customers drop out at checkout. Maybe the cart is too small. Maybe product pages don't convert. Maybe existing customers never buy again.
And perhaps you're already investing in new demand, even though bigger levers sit closer to the money.

Purchase intent present. Order lost.

Traffic present. Too few purchases.

Customers buy. But not enough.

First purchase made. Second purchase missing.

Growth gets more expensive with every euro.

ROAS looks good. Contribution margin doesn't.
Our system
We follow the money backward – from result to demand. Each station opens a complete dossier with goal, metric, problems and possible levers.
We check backward from the result, then prioritize with your shop data by expected impact, effort and feasibility. An earlier station isn't automatically more important.
We don't optimize for vanity metrics
Signature metric
What's actually left after product costs, fulfillment, payment and marketing?
Revenue
− Product costs · − Fulfillment · − Payment · − Marketing
= contribution margin after marketing, before fixed costs
What does a new customer cost?
How much demand is actually monetized?
How much revenue does each order generate?
How much value is created after the first purchase?
How efficiently does marketing work as a whole?
What is a customer worth in the long run?
Case Study
+484 %
Year-over-year revenue, 2020 vs. 2021
What the bottleneck demands
Depending on the station where money is lost, we apply different skills.

01
02
03
04
05
06
No black box
Account structure, campaigns, bidding logic and budget control, run by us and visible to you.
Product data, attributes and feed rules so Shopping covers the entire range.
Assessment of the purchase journey from entry to order confirmation, with prioritized levers.
Purchase arguments, trust elements, price presentation and structure for each product type.
Hypotheses with expected impact, effort and sequence.
A look at the numbers that describe the money path.
Which events are measured, how they're defined and where they end up.
What happened, what we conclude from it and what's next.
Scenarios instead of promises: what happens with which change?
The order of work along the money path.
Quick test
Assessment
Enter your numbers. The assessment appears as soon as enough values are available.
The output is a rough estimate based on your inputs, not an expert opinion or a forecast.
Efficiency · Focus on one high-margin product, shopping feed and remarketing.
Scaling · Google Ads for Germany and the Netherlands.
Conversion · Campaigns cleaned up, shopping feed improved and purchase barriers reduced.
Historical project results. Starting points and time frames differ; the details are in the respective case studies.
Collaboration
Understand shop, marketing, economics and data.
Identify the most economically relevant bottleneck.
Apply the right skills.
Test hypotheses systematically.
What works gets more capital.
Lasting work along the entire money path.
Individual, depending on scope and starting point.
Analyze my shopFor clearly defined problems.
Google Ads · Tracking · CRO · Feed · Audit
Analyze my shopFor in-house teams that handle implementation themselves.
Strategy · Prioritization · Sparring
Analyze my shopDecision aid
As soon as there is existing demand and regular orders. Without demand, we'd be optimizing a path no one is walking yet.
That depends on margin, basket and market size. What matters isn't the size of the budget but whether an extra euro brings in more contribution margin than it costs. We clarify that before we work together.
No. Shopify and Shopware are common, but the work depends on the business model and the data, not the system.
Yes. But we'll tell you if the bigger lever lies elsewhere.
Yes, as part of the money path: purchase journey, product pages, cart and checkout.
Technical and structural errors often take effect in the short term. Anything involving learning phases, tests or repeat purchases needs months rather than weeks. We tell you up front what becomes measurable when.
By economic metrics: contribution margin, CAC, AOV, repeat purchase rate and MER, not by ROAS alone.
We discuss models individually. Purely success-based compensation requires full data transparency and stable measurement.
Then we first clarify whether there is really a gap. A second provider at the same station rarely brings in more money.
Yes. A defined audit is a common way to start and provides the basis for prioritization.
The person who analyzes your shop also works on the implementation.
Your next bottleneck
That's exactly what the money path is for. We analyze at which station economic value is currently being lost and where we would start first.
Not a generic agency pitch. We talk about your shop, your numbers and your next bottleneck.
“Thanks to the support we now reach significantly more new customers through the Google Ads channel and can make even more food lovers happy. I'd especially like to highlight the always transparent and fair collaboration, which I haven't experienced in this form with any other agency.”
The first step
A free 15-minute initial consultation to size up your store: where does it stand, where is the biggest bottleneck likely to be, and does working together make sense? Not a comprehensive audit – an honest first assessment.
Analyze my shopCase studies
Published projects with documented figures. Every card leads to the full case study.
Google Ads · E-commerce. Year-over-year revenue, 2020 vs. 2021, in the managed account.
Google Ads · Tracking. Ad costs saved per year, with the same number of leads.
Google Ads · E-commerce. Focus on a high-margin product, shopping feed and remarketing.
Customers
299 projects since 2016, from online stores to enterprise brands. A selection of current and past projects. The logos are the property of the respective brands.
As seen in







Next step
Pick the spot that's holding your online store back the most.
Reach more of the right buyers, with campaigns, products and landing pages steered by contribution margin.
Learn more
Lead more visitors to purchase, from product page and cart through checkout.
Learn more
Organize range, bundles and purchase incentives so that order value and margin grow together.
Learn more
Keep going after the first purchase, with the right occasions, journeys and a clear view of customer value.
Learn more
Fit
Especially worthwhile if …
In the end, an honest assessment – even if it's “not yet.”
Still too early if …
Then a later time is usually the better investment. We'll tell you so openly in our conversation.
Ready?
Maybe it's in a shopping cart that never gets ordered. In a campaign that just needs the right matching. In a product page that loads a tick faster. The initial consultation shows you, in 15 minutes, with your numbers.
15 min · No obligation · With your numbers
In the end, an honest assessment of whether and where we can help.
View pricingActive since 2016 · 299 projects