PerformancePerformance
+484 %
Year-over-year revenue 2020–2021
Google Ads for E-Commerce
We connect Search, Shopping, Performance Max and product feeds with your shop's numbers, so budget is allocated by actual profitability, not just ROAS.
In the initial consultation, we look at your account, feed and shop numbers and identify the likely biggest lever.
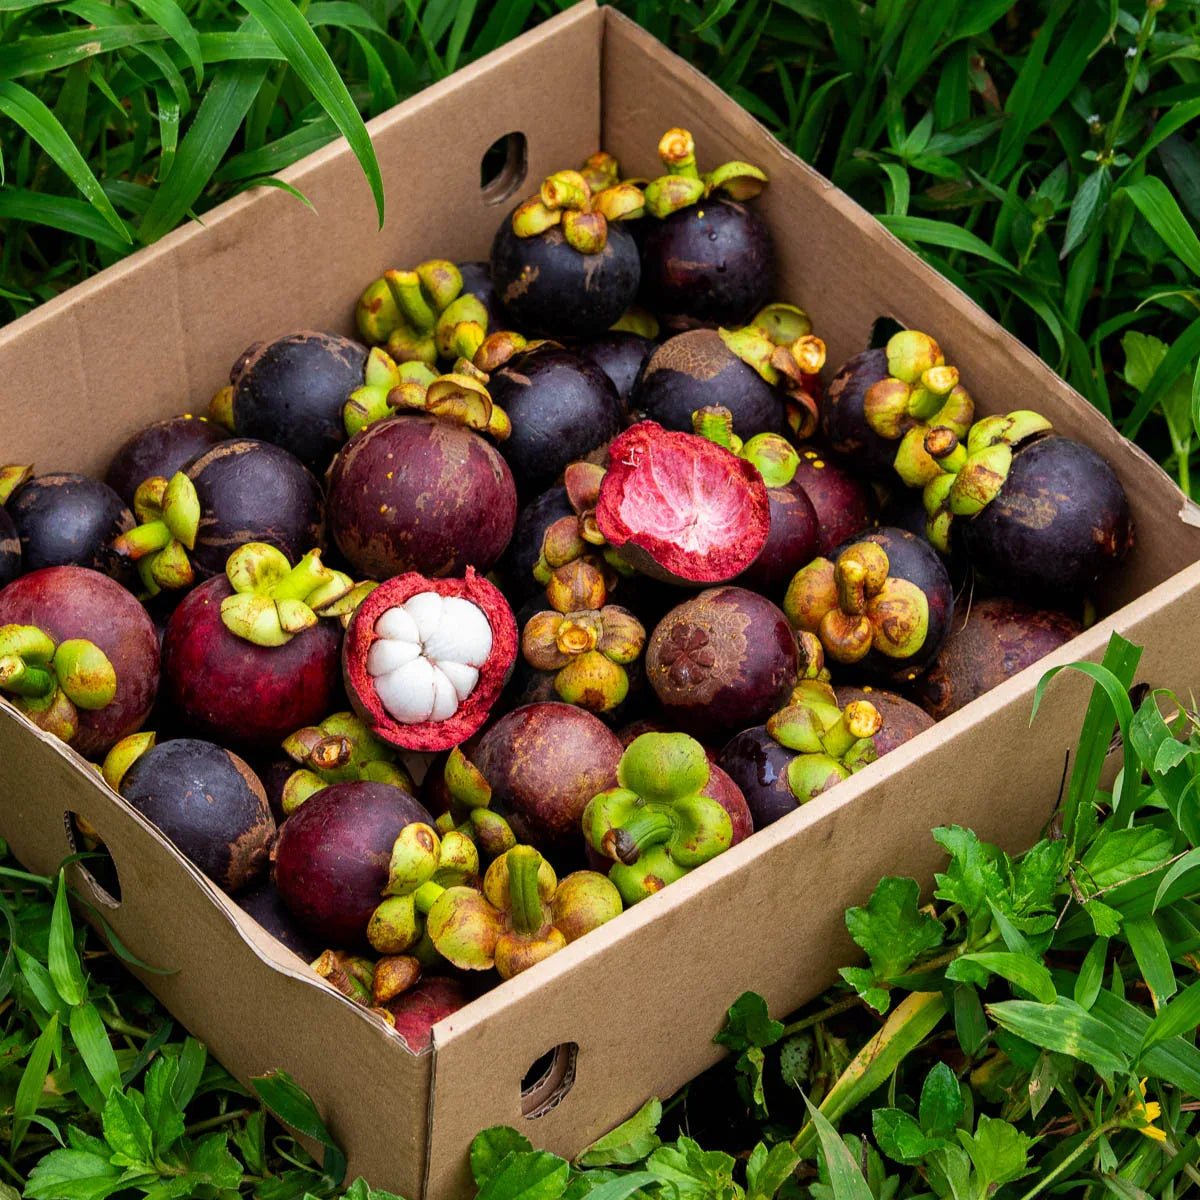
Published Google Ads case studies from online retail, including Jurassic Fruit, Lill’s and YIONN, with documented starting points, measures and results.

Google Ads · E-commerce customer projects
Three shop projects first; more Google Ads work, including a B2B project, follows further down. The metric on each card is the one documented in that project, historical and with its own time frame. A ROAS doesn't let you infer profit growth; the case study puts it in context.
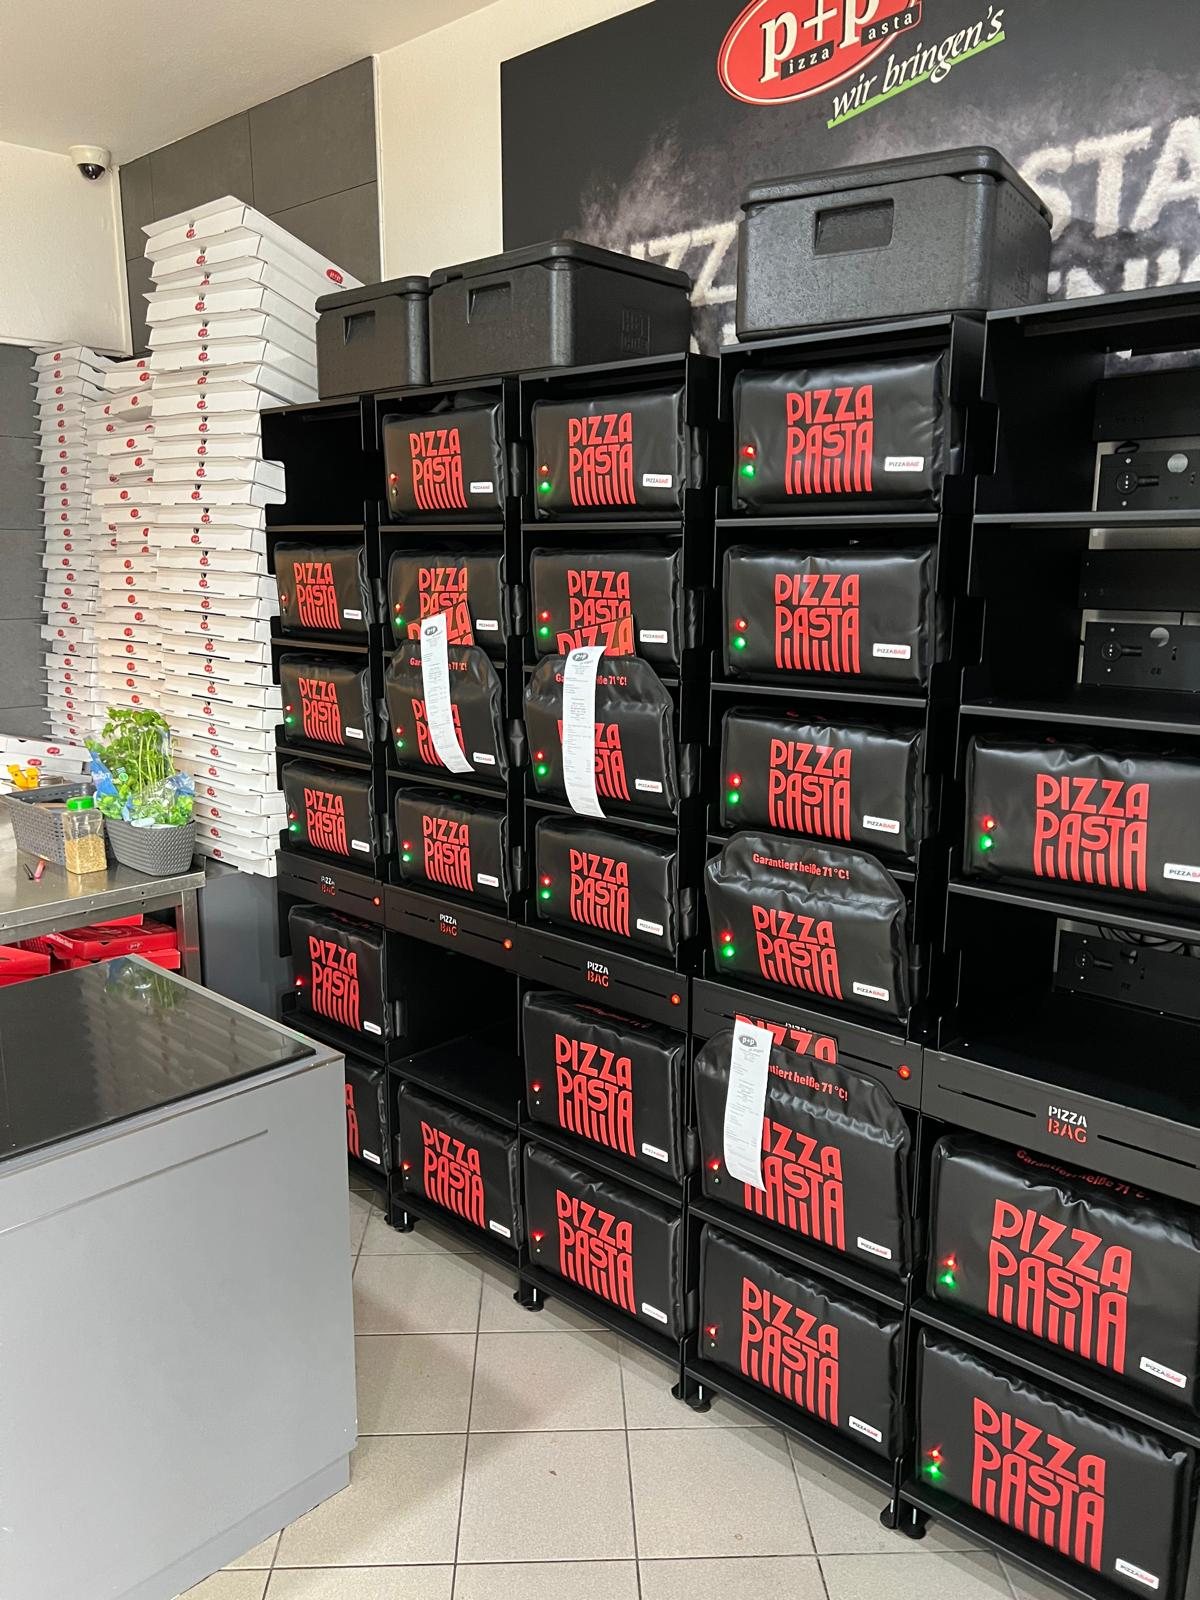
Path of the money: Stage 08 Ready-to-buy demand — Action: Search, Shopping and product feeds for a seasonal range.
Path of the money: Stage 08 Ready-to-buy demand · 09 Interested prospects — Action: focus on one high-margin product, shopping feed and remarketing.
Path of the money: Stage 08 Ready-to-buy demand — Action: Google Ads for Germany and the Netherlands.
Historical project results. Starting points and time frames differ; you'll find the details in the respective case studies. Revenue, ROAS and conversion figures don't prove an increase in contribution margin.
Before / After
No average, no extrapolation: two project timelines from published case studies with traceable starting values – where a starting value is calculated, it says so.
Monthly revenue · Year over year
+€30,900 per month
What happened over time
Baseline calculated from the published end value (€54,200) and increase (€30,900). The source documents monthly revenue year over year; it does not name specific years or an exact attribution of total revenue to Google Ads.
View case studyProject “Muscle Recovery Tool” · ROAS of the Google Ads campaigns · Six weeks
ROAS 3.97 → 7.54 with lower ad costs
What happened over time
The higher ROAS came mainly from lower ad costs; conversion value over the period was $7,500 lower. Both figures appear this way in the case study.
View case studyWhen ROAS looks better than the account
Revenue, ROAS and contribution margin are different metrics. If you only look at the platform figure, you may scale the wrong result.
A product with a high ROAS can leave little or nothing after cost of goods, shipping and returns.
When bids optimize for revenue, budget flows to high-revenue products rather than high-contribution ones.
Brand searches and repeat buyers make ROAS look good without winning new customers.
Incomplete tracking, missing consent signals or feed errors only get more expensive with more budget.
The first lever is often between the ad account, the product feed and the cart.

Working backward from the order
First we clarify what acquisition cost an order can bear. Then we review setup, range and campaigns, and see whether the shop turns traffic into orders.
Contribution margin per product and order, and the maximum acquisition cost the first order can support.
Result A break-even ROAS and a target ROAS based on your numbers.
Tracking, consent, Merchant Center and product feed.
Result A prioritized list of measurement gaps and feed errors.
Group products by demand, margin, returns and inventory.
Result A campaign and feed structure that directs budget to where contribution is generated.
Use Search, Shopping and Performance Max where they fit the demand.
Result A campaign plan with budget allocation that you see before launch.
Check product page, cart and checkout for friction before buying more traffic.
Result Notes on stations 05, 04 and 03 in the money path.
Additional budget only for reliable, measurable hypotheses.
Result A person reads the request and gathers information.
We look at revenue, ROAS, CAC, conversion rate, contribution margin, new-customer share and repeat purchases, as far as your data reliably supports each one. What can't be measured, we state explicitly.

Calculator · First order
Enter your own values per order, all net. The calculator uses no industry benchmarks, starts empty, and shows every formula openly.
Result
Enter order value, cost of goods, payment, fulfillment, and return costs.
All values net, excluding VAT. The calculation looks only at the first order; repeat purchases are deliberately not included. ROAS figures in Google Ads often refer to gross revenue – check first which values your account reports.
What we take on
You get a prioritized proposal for your existing setup. We build on what works and define who takes on which changes.
Analysis, campaign structure, budget planning, search terms and exclusions.
Product data, titles, attributes and feed rules for Shopping and Performance Max.
Tracking and consent review, analysis by contribution and the next measures.
Campaign types matched to the goal: Search, Shopping, Performance Max, YouTube/video, Demand Gen and Display. The agreed scope determines the mix. Depending on the agreement, we make changes in the shop ourselves or coordinate them with your team.

Understand goals, existing data and bottlenecks.
Document measures, responsibilities, management and ad budget transparently.
Implement, review results and prioritize next steps.
When a conversation makes sense
If tracking, feed or margin are still unclear, we settle these foundations first. More ad budget alone doesn't solve that bottleneck.
Shop conversion: product page to payment
As seen in







Before you decide
That depends on range, data and demand. Search covers specific search terms, Shopping shows products with image and price, and Performance Max bundles several placements but gives less insight. We use each depending on the situation and separate brand demand from new-customer demand where possible.
One that follows from your numbers: net order value divided by the acquisition cost a first order can bear. The calculator on this page shows the formula. We don't use industry averages for it.
Shopping and Performance Max work with the data from your feed. Missing attributes, weak titles or wrong availability cost visibility and send budget to the wrong products.
We also look at product page, cart and checkout, because more traffic to a shop with friction mainly just gets more expensive. Which changes we implement ourselves is set out in the scope.
Yes. We check which campaigns, data and structures can still be used. A rebuild only makes sense where the analysis justifies it.
Management follows the agreed scope. We show ad budget and management separately.
No. Demand, competition, range and data quality all affect the outcome. We make measures and measurement limits transparent instead of promising a fixed return.

Your next step
Talk to us about your shop, your current campaigns and whatever doesn't add up in your reporting. We'll clarify where Google Ads, feed or shop should come first.
Your shop URL and a rough overview of your advertising so far are helpful. No account access is needed to book an appointment.

Case studies
Published projects with documented figures. Every card leads to the full case study.
Path of the money: Stage 08 Ready-to-buy demand — Action: shopping setup and search campaigns for international markets.
Path of the money: Stage 08 Ready-to-buy demand · 05 Product interest — Action: campaigns cleaned up, shopping feed improved and purchase barriers reduced.
B2B project, not an online shop — Measure: Custom tracking for a complex customer journey.
Customers
299 projects since 2016, from online stores to enterprise brands. A selection of current and past projects. The logos are the property of the respective brands.
As seen in
Next step
Pick the spot that's holding your online store back the most.
Reach more of the right buyers, with campaigns, products and landing pages steered by contribution margin.
Learn more
Lead more visitors to purchase, from product page and cart through checkout.
Learn more
Organize range, bundles and purchase incentives so that order value and margin grow together.
Learn more
Keep going after the first purchase, with the right occasions, journeys and a clear view of customer value.
Learn more
Fit
Especially worthwhile if …
In the end, an honest assessment – even if it's “not yet.”
Still too early if …
Then a later time is usually the better investment. We'll tell you so openly in our conversation.
Ready?
Maybe it's in a shopping cart that never gets ordered. In a campaign that just needs the right matching. In a product page that loads a tick faster. The initial consultation shows you, in 15 minutes, with your numbers.
15 min · No obligation · With your numbers
In the end, an honest assessment of whether and where we can help.
View pricingActive since 2016 · 299 projects